My family is chock full of avid skiers. We put our two kids through ski racing programs, and now they can ski pretty much anything we throw at them. After being dedicated mountain pass holders, then Ikon pass holders, then nomads purchasing advance tickets, I thought it'd be cool to create a map-based way of discovering new ski resorts. It'd be a cool way to visualize where they were, and whether they were included in popular pass programs like Ikon and Epic.
Creating a Simple Interactive Map
I've been programming in React at work, and have used the Google Maps API in the past. When I came across this Smashing Magazine post, I tried to follow the steps to create my own map. The post didn’t link out to a repo of a fully-working example, so I created this pared back version of my final project as a resource for anyone wanting to do this on their own. Feel free to fork the repo and use it as a basis for your own map development! Check out the video below for a walkthrough of these links:
- Simple Interactive Map: Ten Highest Peaks of the Oregon Cascades
- GitHub Repository: React Leaflet Maps
Ski Resort Finder
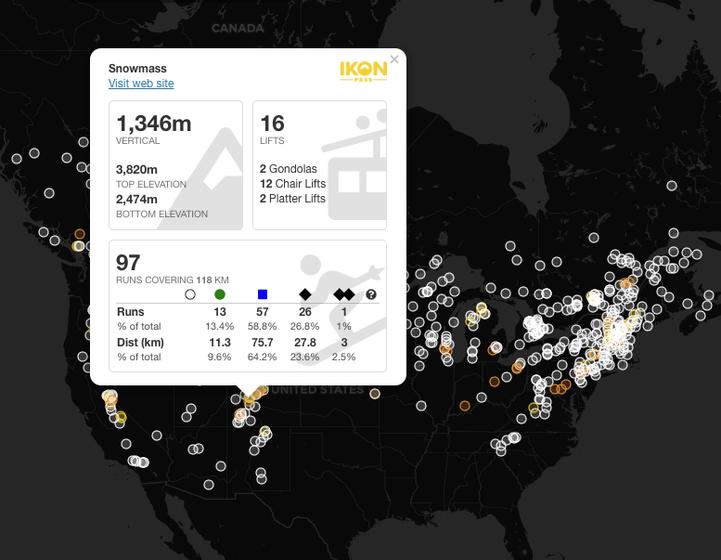
Now it's time to get fancy, both with design and functionality. The site is deployed at skiresorts.netlify.app, and here's a quick video demo of the functionality.
Now, on to the code! I'll be referring to snippets of code from my GitHub repository so head over there if you want a fuller picture.
Getting the Ski Resort Data
The app's componentDidMount function fires off an axios GET request for the ski resort data from skimap.org's developer API. Once that result comes back, I map each resort to a "resorts" array. Each object in the array contains information about the resort, including the name, details about the lifts and runs, and a geographic point to plot the resort. Some of the resorts in the API provide a series of polygons. In those cases, I'm using a function getCenterOfPolygon to get the center point of the first polygon in the data set. It works well enough!
You see that Firebase request in the above code? The skimap.org data doesn't include pass information, so I created a dataset in Firebase to store resort names that belong to either the Epic or Ikon portfolios. This is where the data caveat comes in: if any resort information is not accurate, it can be updated by anyone over at openskimap.org. However, I am maintaining the pass flags for Epic and Ikon resorts in my own Firebase account. I used a CSV to JSON converter to get the Epic/Ikon data from a Google Sheet into the format that Firebase can import.
Plotting the Ski Resort Data
Now that I have the ski resort data all in the app, it's time to plot the points. This is where I had the most fun, since there are a lot of interactions and design elements. Here are the notable parts of the code:
Map Tiles
There are a ton of options for the map tiles. I chose an option that didn't need any license or key (see: line 16). Depending on the map you choose, you should make sure you're attributing the source properly (see: line 15).
Leaflet Map Performance
When you're rendering thousands of items on a map, don't use images. I had started with images and it was way too sluggish. Instead, leaflet provides SVG markers, so that's what CircleMarker is in the code. You specify the color, opacity, radius, and weight. Also on the performance front, I set the leaflet map's attributes for updateWhenZooming (false), updateWhenIdle (true), and preferCanvas (true) to optimize performance.
Leaflet Popup Interaction Model
I made an early mistake where I was creating a Popup for each resort on the map. Wow, that slowed things down! The way this is written now, there's one Popup, which makes a lot more sense. When you click a CircleMarker, line 26 sets the state's activeResort. An activeResort in turn shows the Popup using the activeResort's point to plot the position. Lastly, my custom SkiMapTooltip component is a richly-styled component to show the resort's details. I pass the activeResort and the units (metric or imperial) to this component.
Deploying the App to Netlify
The last step was pretty simple, actually. I deployed the application via Netlify using these instructions (see point 6). This was my first experience with Netlify, and it was really smooth. I also wanted to make sure that I hid my Firebase API key, and Netlify made that easy, too. I updated my code per this article's advice on hiding API keys in React .env files. Then, in Netlify, I set my REACT_APP_FIREBASE_API_KEY as an environment variable. Now, whenever I push a code update to GitHub, Netlify automatically picks up the change, builds the project, and deploys it.
Recap & Links
That's it! A simple map with React and Leaflet, and a more complicated map built on those simple principles.
Related Posts
There are 23 other posts like this one. Here are some other recent ones:
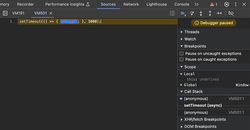
 How to Inspect Hovered Elements (Menus, Tooltips, and Dialogs, Oh My)July 1, 2024 – I found this technique useful for debugging CSS inside ephemeral DOM elements.
- How to Automatically Create Google Calendar Events from a Google SheetFebruary 12, 2023 – If you need to automatically create Google Calendar events from data in a Google Sheet, this pared-down example should work well for you.
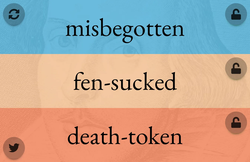
- Shakespeare Insult GeneratorOctober 10, 2021 – I created this Shakespeare Insult Generator: it converts three arrays of adjectives and nouns into a delightful random insult that would have thrilled the Bard himself.